Figure 5.
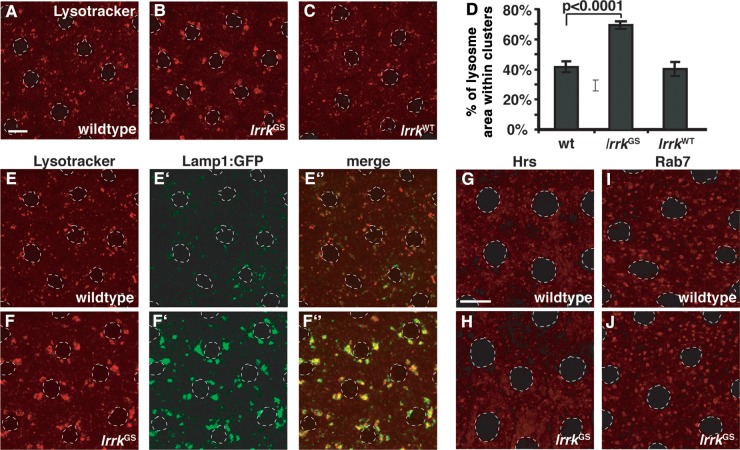
Expression of lrrkGS drives perinuclear positioning and clustering of lysosomes. (A–C) Lysotracker staining of follicle cells from stage 12 egg chambers. In wild-type follicle cells (A), most Lysotracker-positive vesicles are individual and distributed throughout the cytosol, although small clusters are often seen. Expression of lrrkGS (B) in follicle cells causes almost all Lysotracker-positive structures to collapse into one to four compact perinuclear clusters, while equivalent overexpression of lrrkWT (C) results in no significant changes in the distribution of Lysotracker-positive structures relative to the wild-type. (D) Quantification of lysosome clustering from the genotypes depicted in (A)–(C). (E and F) Lysotracker staining of wild-type (E) and lrrkGS-expressing (F) follicle cells also expressing the lysosomal marker Lamp1:GFP. Lamp1:GFP-positive vesicles are clustered in lrrkGS-expressing cells (F′), colocalizing with Lysotracker (F″). Note that Lamp1:GFP accumulates to a much higher degree in lrrkGS-expressing cells (F′) versus wild-type (E′) in images taken with equivalent microscope settings, suggesting that expression of lrrkGS stabilizes Lamp1:GFP. (G–J) Labeling of early endosomes with the marker Hrs (G and H) and late endosomes with the marker Rab7 (I and J) reveals no significant difference between wild-type (G and I) and lrrkGS-expressing cells (H and J), demonstrating that the clustering effect of lrrkGS is specific to lysosomes. Follicle cell nuclei are outlined with dashed gray lines in all images. Scale bar in (A) represents 5 μm in (A)–(F); scale bar in (G) represents 5 μm in (G)–(J).

