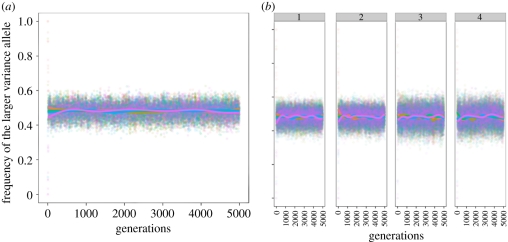
Figure 2.
Robustness of the equilibrium to initial conditions at the M/m locus. The parameters are: α = (−4), β = 4, μ = 10−4, σ1 = 1, σ2 = 2, the environment changes every five generations and we start with different initial frequencies of the M/m alleles at the modifier locus. Each point represents the average across 100 different runs of the simulation. The plotted curves represent a fit to the data using a generalized additive model with penalized cubic regression splines. (a) Equal initial frequencies of the A/a and B/b alleles. (b) Panel 1 corresponds to starting frequencies for A and B of 0, panel 2 corresponds to initial frequencies of A and B of 0.5, panel 3 corresponds to initial frequencies of A allele of 0.9 and B allele of 0 and panel 4 corresponds to initial frequencies of alleles A and B of 0.1 and 0, respectively. (a,b) Initial frequencies of the larger variance allele: red curve, 1; light green curve, 0.9; dark green curve, 0.5; blue curve, 0.1; pink curve, 0.

