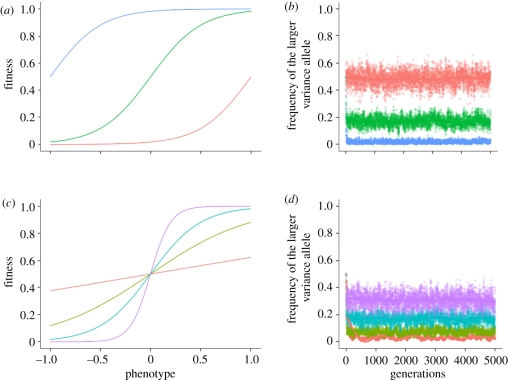
Figure 3.
Effect of varying α and β on the equilibrium frequency at the M/m locus. (a) Fitness functions, varying the α parameter, with β = 4. (b) Effect of varying the α parameter on the equilibrium frequency at the M/m gene. The other parameters are β = 4, μ = 10−4, σ1 = 1, σ2 = 2 and the environment changes periodically every five generations. (c) Fitness functions, varying the β parameter, with α = 0. (d) Effect of varying the β parameter on the equilibrium frequency at the M/m locus. The other parameters are α = 0, μ = 10−4, σ1 = 1, σ2 = 2 and the environment changes periodically every five generations. In (b) and (d), each point represents the average across 100 different runs of the simulation. The plotted curves represent a fit to the data using a generalized additive model with penalized cubic regression splines. (a) α: red curve, −4; green curve, 0; blue curve, 4. (b) The α parameter: red curve, −4; green curve, 0; blue curve, 4. (c) β: red curve, 0.5; light green curve, 2; blue curve, 4; purple curve, 10. (d) The β parameter: red curve, 0.5; light green curve, 2; blue curve, 4; purple curve, 10.

