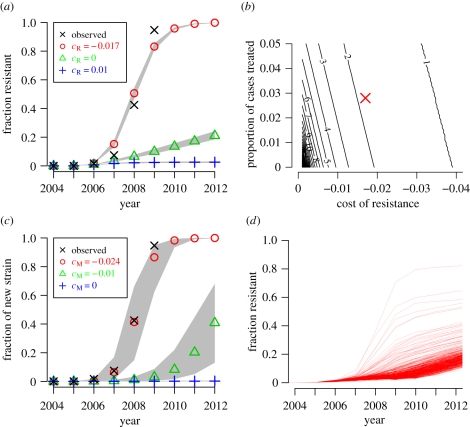
Figure 2.
The resistant strain must be slightly more transmissible than the sensitive strain. (a) Simulated fraction of resistant isolates when the oseltamivir-resistant strain is 1% less transmissible (cR = 0.01), equally transmissible (cR = 0), or 1.7% more transmissible (cR = −0.017) than the oseltamivir-sensitive strain. The black crosses show the actual prevalence of resistance among sequenced seasonal H1N1 neuraminidases. The grey regions represent range covered by 95% of the 500 simulations. (b) The number of years for a resistant strain to rise from 1% to 50% prevalence for various values of cR and the proportion of cases treated in a simplified and deterministic model. Our estimate for the actual values is indicated by the red X. (c) Simulated fraction of mutant isolates in a simple strain-replacement model when no antivirals are used and the mutant strain is 0%, 1% or 2.4% more transmissible than the original strain (cM = 0.0, − 0.01, − 0.024). (d) Simulated fraction of resistant isolates when there are independent occurrences of an oseltamivir-resistance mutation that does not affect transmissibility (cR = 0) and a second mutation that confers at 2.4% increase in transmissibility (cM = −0.024). Each represents one of 500 runs of the stochastic simulation. There is wide variability in the spread of resistance depending on whether there is a stochastic co-occurrence of the two mutations early on. (a) Crosses, observed; circles, cR − 0.017; triangles, cR = 0; plus symbols, cR = 0.01. (b) Crosses, observed; circles, cM = −0.024; triangles, cM = −0.01; plus symbols, cM = 0.

