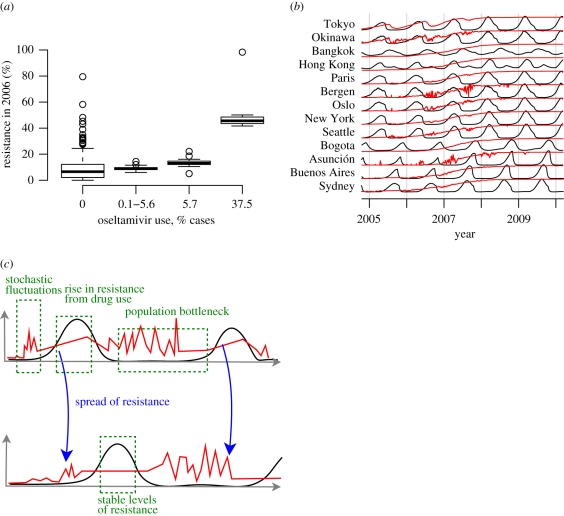
Figure 3.
Simulated levels of oseltamivir resistance in individual cities. (a) The fraction of resistant strains from a single simulation in individual cities for the calendar year 2006 when resistance hitchhikes on a fitness-enhancing mutation (cM = −0.024, cR = 0). The thick horizontal lines indicate the median fractions of resistance, the boxes outline the first and third quartiles, and the whiskers show the range of 95% of the data. The first resistance mutations occur in 2005 in the simulations. (b) Simulated antiviral resistance in selected cities when resistance hitchhikes on a fitness-enhancing mutation (cM = −0.024, cR = 0), for the simulation shown in (a). Black lines plot infection prevalence in a city, and red lines plot the fraction of resistant strains. (c) Illustration of the transmission of resistant influenza strains between cities. The black lines plot infection prevalence, and the red lines plot the fraction of infected individuals who have the resistant strain.

