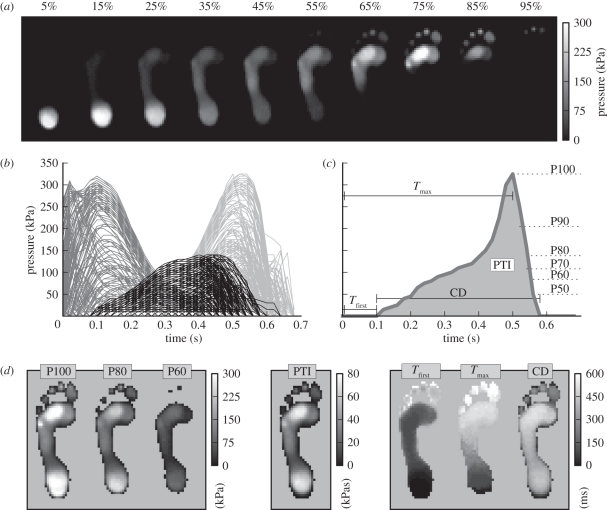
Figure 1.
Description of plantar pressure data for a single step. (a) Pressure image time series; percentages indicate normalized time (% stance). (b) Pixel time series; dark grey, black and light grey trajectories indicate pixels whose maxima were reached in the first, second and final thirds of stance phase, respectively. (c) Pre-features for an example pixel time series (see table 2 for variable descriptions). (d) Pre-features, when computed across all pixels.

