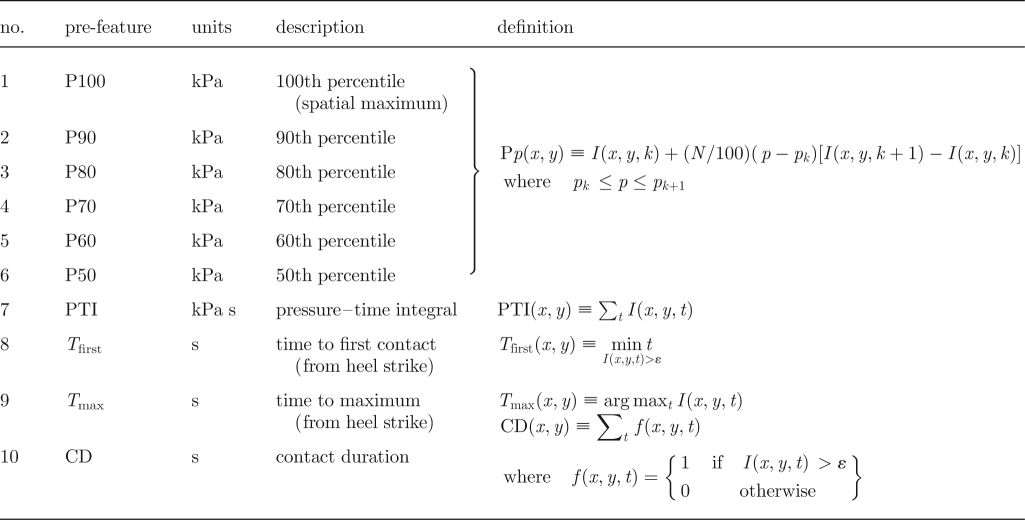
Table 3.
Pre-feature descriptions. Here, I(x,y,t) is the image time series, p denotes percentile, k indexes the ordered observations of a particular pixel's time series, pk is the percentile of the kth ranked observation, n is the number of observations and ε is a pressure threshold (manufacturer-set to ε = 5 kPa in the current dataset). In the percentile equation k is not a time index, but rather indexes sorted observations and k may be different for each pixel's time series.
 |
