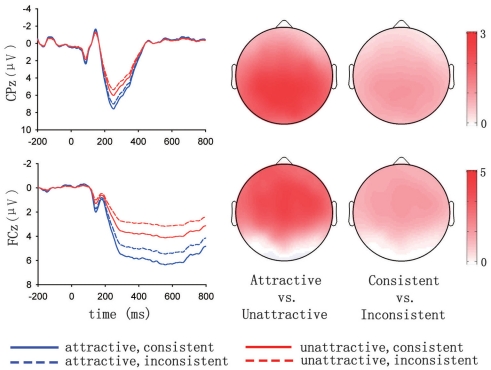
Figure 4.
ERP responses on the exemplar electrodes converted from factor scores in the spatiotemporal PCA and depicted as a function of attractiveness and feedback consistency. Topographic maps on the right side present the differential responses corresponding to the factors depicted on the left. Sketches in the upper and lower panels correspond to the first and the second selected spatiotemporal factors, respectively.

