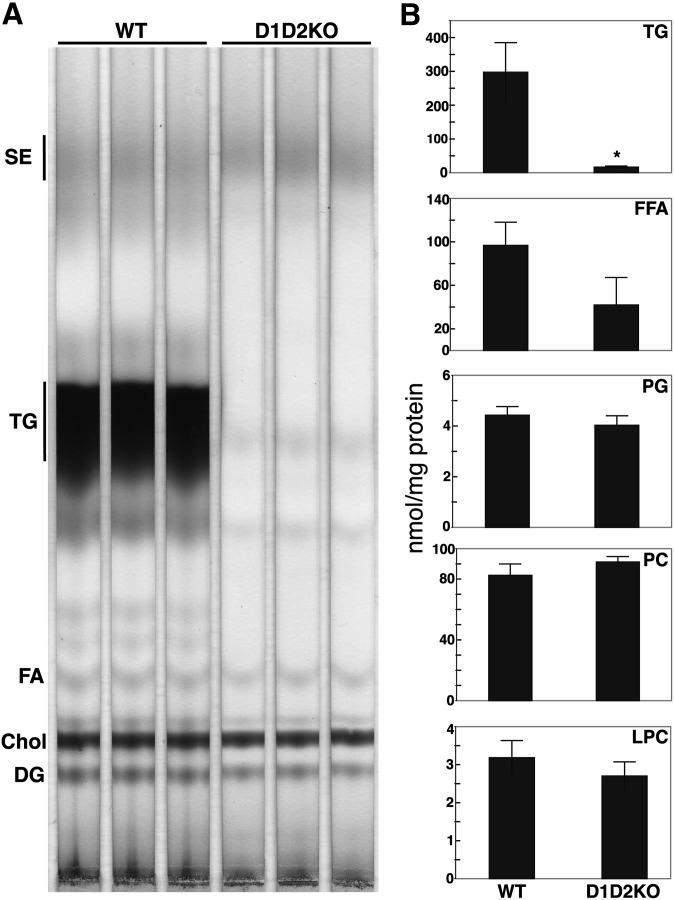
Fig. 3.
D1D2KO adipocytes have reduced TG levels. A: Charred TLC plate of lipid extracts from WT and D1D2KO differentiated cells. B: Quantification of mass spectrometry analysis of lipids from WT and D1D2KO adipocytes showing content of TG, free fatty acid (FFA), phosphatidylglycerol (PG), phosphatidylcholine, (PC), lysophosphatidylcholine (LPC). * P < 0.05, n = 3. Exogenous FAs were not added during differentiation. The experiment was performed three times, with mass spectrometry performed on a single sample set. Error bars represent SD.

