Fig. 7.
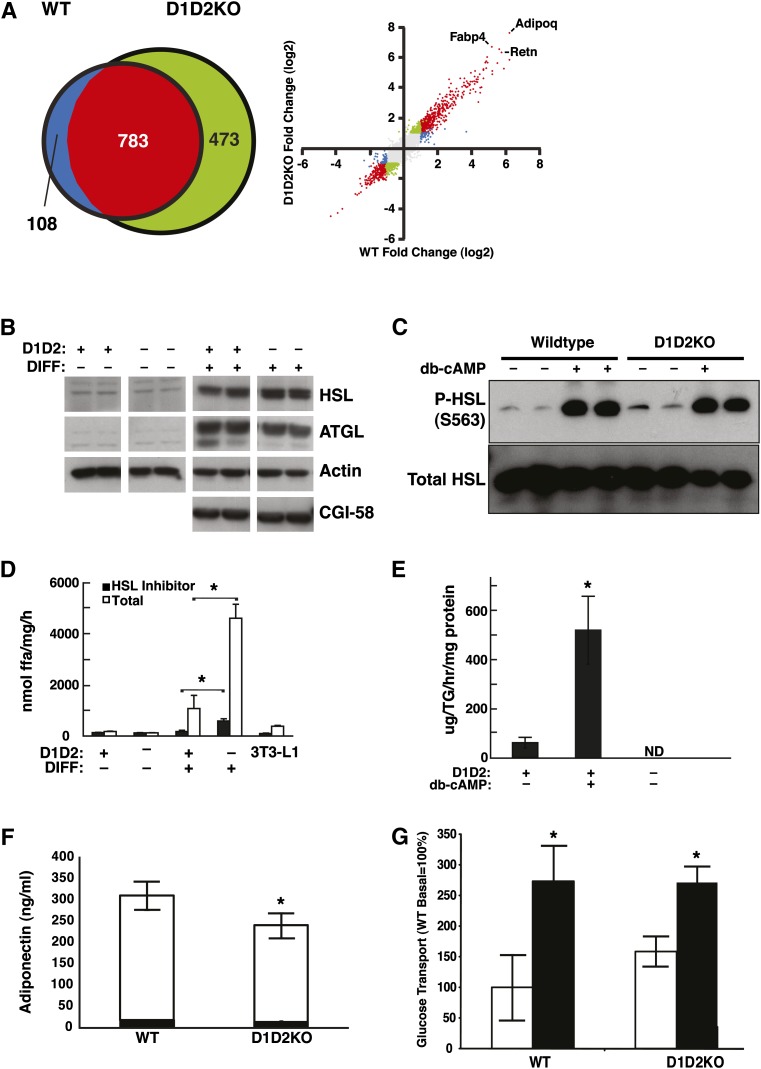
D1D2KO differentiated cells have the cellular physiology of adipocytes. A: Results of microarray analyses of mRNA from WT and D1D2KO cells. Left: Venn diagram of genes regulated differently during differentiation in WT and D1D2KO adipocytes. Right: Scatterplot of induction values (differentiated/undifferentiated) for individual genes in the microarray. Points are color-coded based on meeting criteria for induction with differentiation (2-fold change and P < 0.001): red, meets criteria for both WT and D1D2KO; green, meets criteria for D1D2KO only; blue, meets criteria for WT only; gray, meets criteria for neither. Individual positions of three highly induced adipocyte markers (Adipoq, Fabp4, and Retn) are indicated. B: Expression of HSL, ATGL, and CGI-58 in WT (D1D2+) and D1D2KO (D1D2–) undifferentiated (DIFF–) and differentiated (DIFF+) MEFs. C: Intact phosphorylation of HSL at serine 563 (S563) in D1D2KO adipocytes induced by dibutyryl cAMP (db-cAMP). D: TG hydrolase activity in lysates of D1D2KO undifferentiated and differentiated MEFs and 3T3-L1 adipocytes. E: Glycerol release from WT and D1D2KO adipocytes untreated or treated with db-cAMP. F: Intact total (white bar) and HMW adiponectin (black bar) secretion in WT and D1D2KO differentiated MEFs. (G) Basal and insulin-stimulated glucose transport in WT and D1D2KO adipocytes. White bars, basal; black bars, insulin-stimulated. ND, none detected. * P < 0.05, n = 4. B–G, experiments were performed three times with representative results shown. Error bars represent SD.

