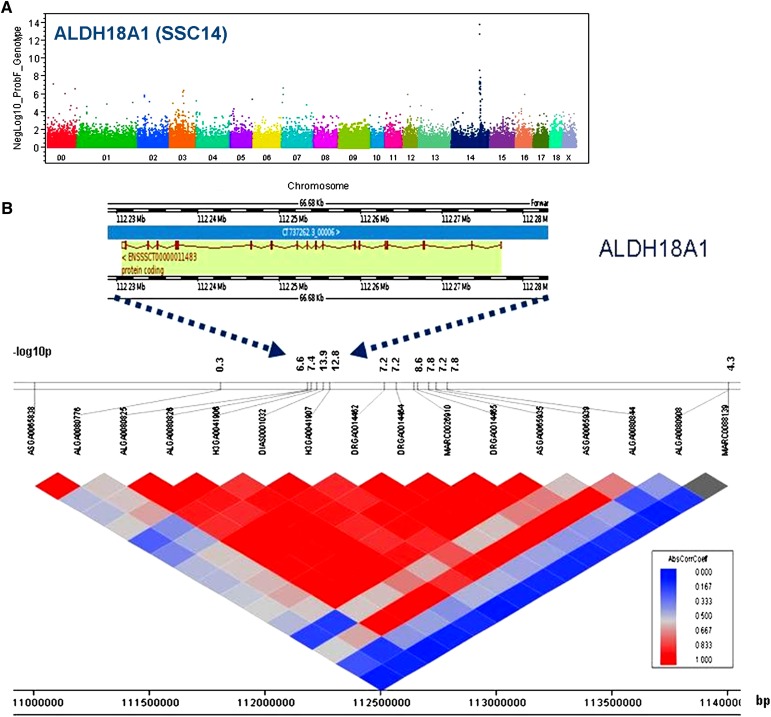
Fig. 2.
Significant association of genetic variation with expression of ALDH18A1. A: The expression level of ALDH18A1 is significantly associated with many SNPs in the same region. The P values (−log10 transformed) on the vertical axis are plotted against the genomic position of SNPs on the horizontal axis. B: ALDH18A1 located at SSC14 position 112 Mb. The P values (−log10 transformed) of SNPs in the same region are listed (indicated by blue arrows). The linkage disequilibrium pattern around the gene is shown. The scale of correlation coefficient varies from red to blue (high to low). SNP positions are located under the linkage disequilibrium pattern.

