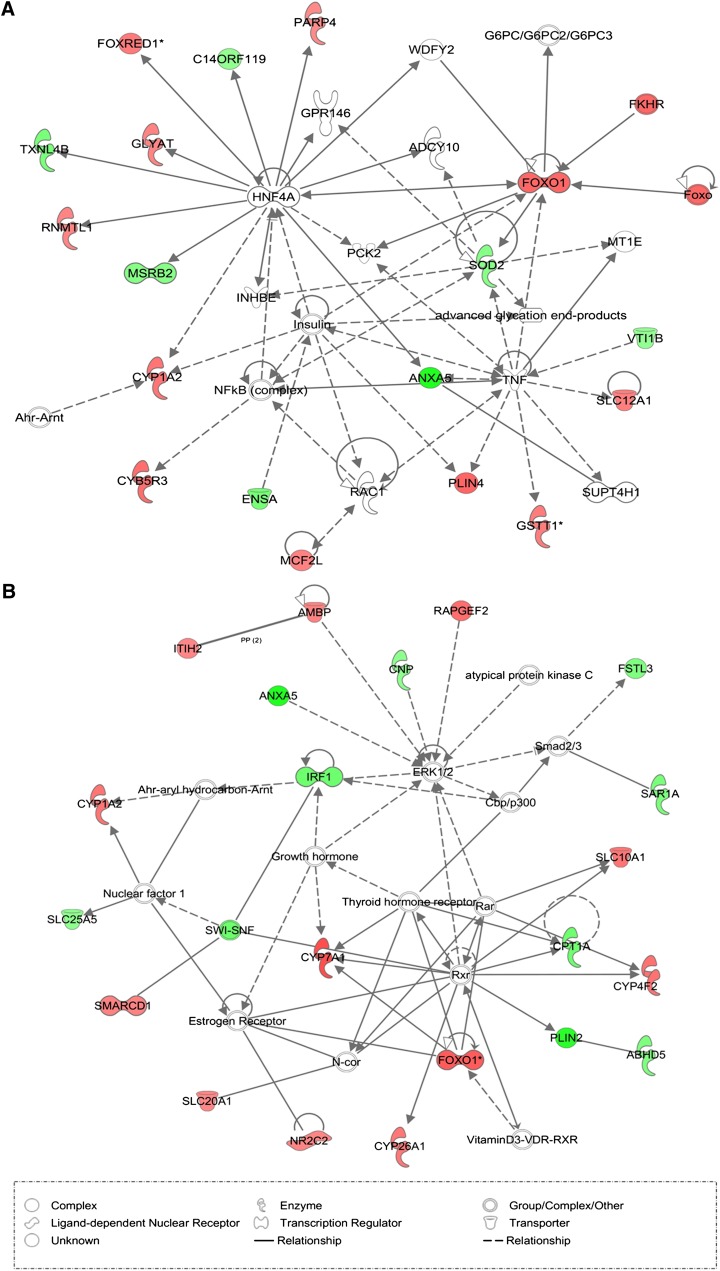
Fig. 3.
Pathway analysis based on the IPKB. The high-scoring gene networks significantly correlated with fat area and (A) cis-regulation or (B) trans-acting eQTL. Both networks belong to lipid metabolism, small molecule biochemistry, and cell death or genetic disorder. Color shading corresponds to the type of correlation, with red for positive correlation and green for negative correlation. The nodes without color are not from the list of correlated genes. The shape of the node indicates the major function of the protein. A line denotes binding of the products of two genes while “acts on” is denoted by a line with an arrow and “direct interaction” by a line without an arrow. A dotted line denotes an indirect interaction.

