
Figure 4.
Hard-sphere like behavior
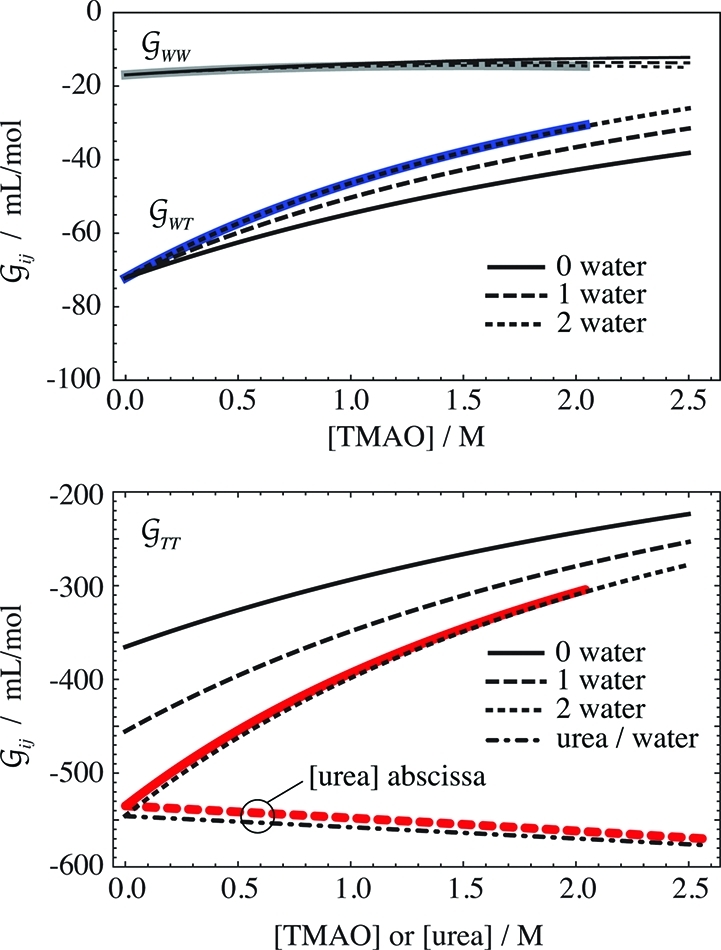
of TMAO. The upper panel shows the TMAO
hydration,  WT (blue), and the water self-hydration,
  WW (gray), at 0 M urea, along
with the hard-sphere behavior calculated for 0 to 2 hydration waters,
using eqs 24 and 25. The
lower panel contains the same information for the TMAO self-solvation,
WW (gray), at 0 M urea, along
with the hard-sphere behavior calculated for 0 to 2 hydration waters,
using eqs 24 and 25. The
lower panel contains the same information for the TMAO self-solvation,  TT (red), at 0 M urea (continuous
red line) and in the limit of 0 M TMAO (dashed red line). The latter
is shown as a function of the urea molarity, and the dash-dotted line
is calculated according to eq 5. The deviations
between the best prediction and the data are smaller than the uncertainty
in the data (∼10 mL/mol).
TT (red), at 0 M urea (continuous
red line) and in the limit of 0 M TMAO (dashed red line). The latter
is shown as a function of the urea molarity, and the dash-dotted line
is calculated according to eq 5. The deviations
between the best prediction and the data are smaller than the uncertainty
in the data (∼10 mL/mol).