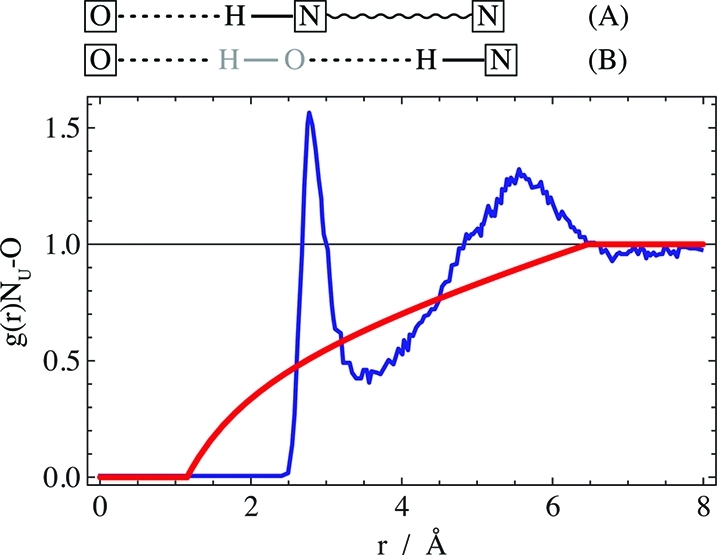
Figure 6.

Radial distribution function of urea nitrogen around TMAO oxygen: blue line, data for about 2 M each of urea and TMAO;43 red line, effect of direct steric exclusion between urea and TMAO (eq 6). Top: schematic illustration of the origin of the peaks for (A) direct H-bonding of urea to TMAO and (B) solvent-separated H-bonding. TMAO oxygen and urea nitrogen are boxed. Water atoms are displayed in gray.
