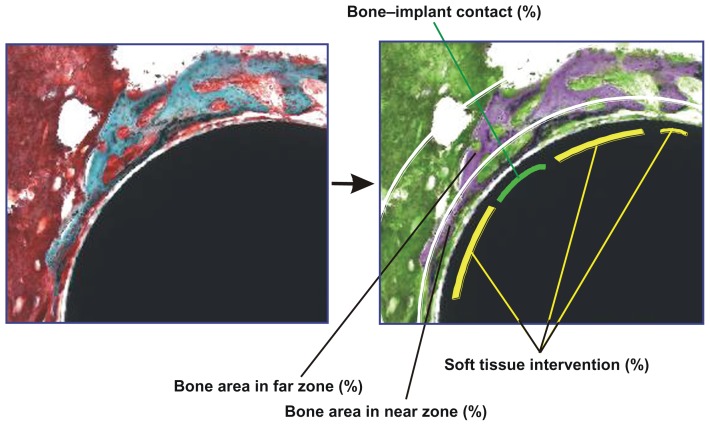
Figure 1.
Description of histomorphometric analysis and parameters. Cross-sectional histological images were color converted to facilitate the discrimination of tissue types (from left to right images). To measure the bone area in the standardized vicinity levels from the implant surface, the tissue area was divided into two different zones: near (50 μm proximity) and far (50–200 μm) zones from the implant surface as segmented by white lines. The green lines represent the bone tissue in direct contact with the implant, while the yellow lines represent the bone tissue separated from the implant surface by soft tissue intervention. See the detailed description in the Materials and Methods section.

