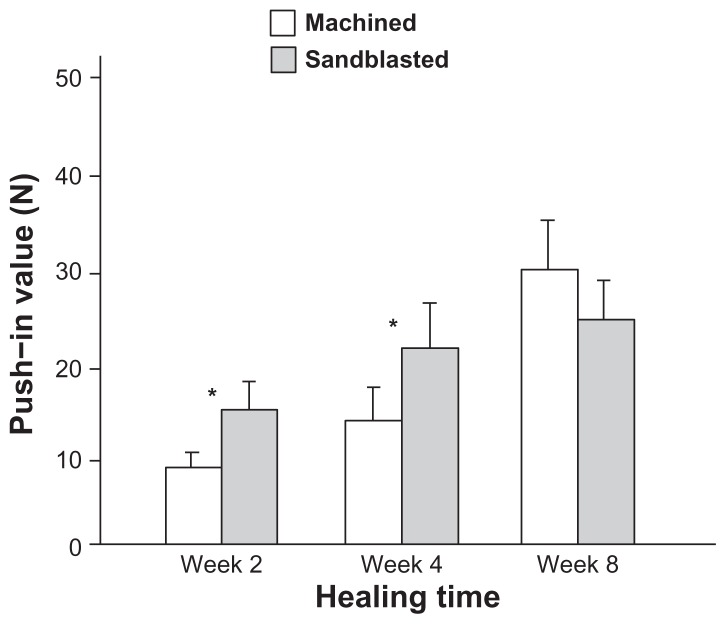
Figure 5.
Microroughness-enhanced bone-titanium integration (implant anchorage in bone) evaluated by biomechanical push-in test. Push-in value of the machined and sandblasted implants at multiple healing times.
Notes: Data are shown as mean ± standard deviation (n = 6). *P < 0.05, indicating a statistically significant difference between the two surfaces.

