
Figure 1.
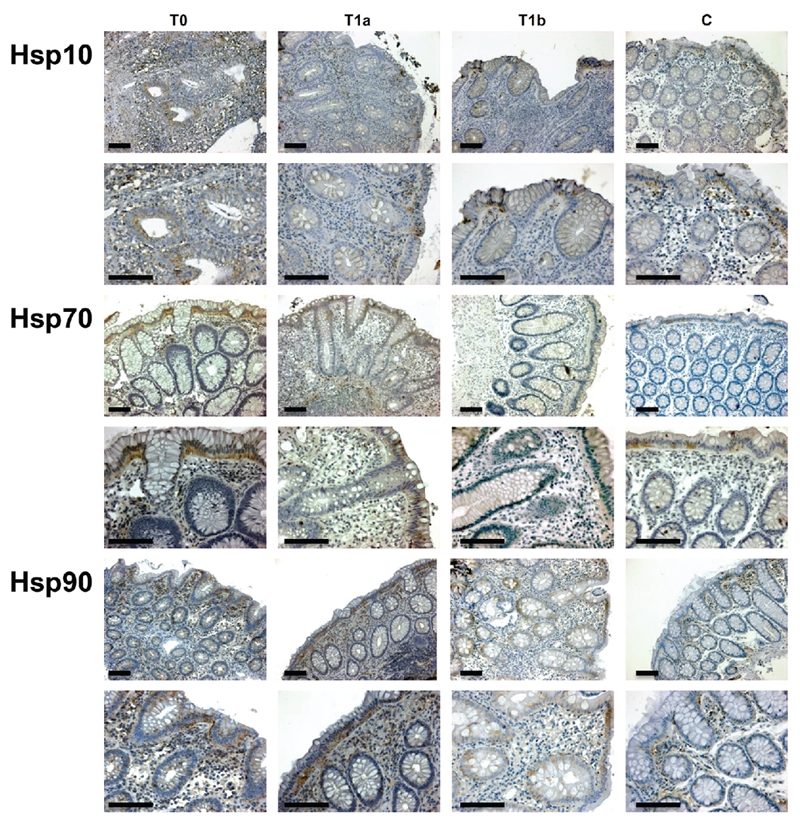
Representative pictures of immunohistochemical results. This figure shows microphotographs of immunostaining for Hsp10, Hsp70, and Hsp90 in all groups studied T0, T1a, T1b, and C, with mucosa sampled: at time of diagnosis, after 6 months of treatment with 5-ASA, after 6 months of treatment with 5-ASA + probiotics, and from patients with non-specific colitis (controls), respectively. Positivity appears brown. Scale bars: 200 µm.