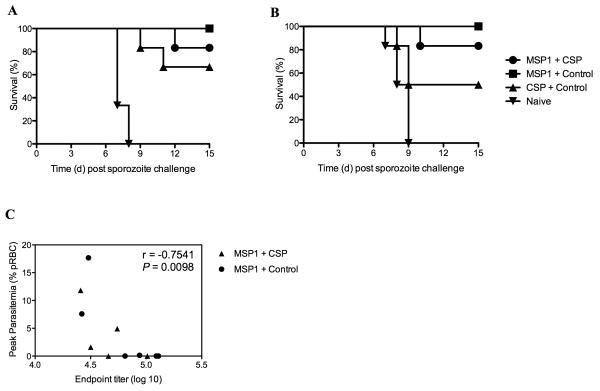
Figure 4.
Survival and peak parasitemia following sporozoite challenge. Mice were challenged with sporozoites as described in Table III. Kaplan-Meier curves show survival following sporozoite challenge two weeks post-boost (A) and ten weeks post-boost (B). Following challenge ten weeks post-boost PyMSP119-specific total IgG titers correlate with peak parasitemia (C). rs = −0.7541 by Spearman’s Rank correlation analysis.

