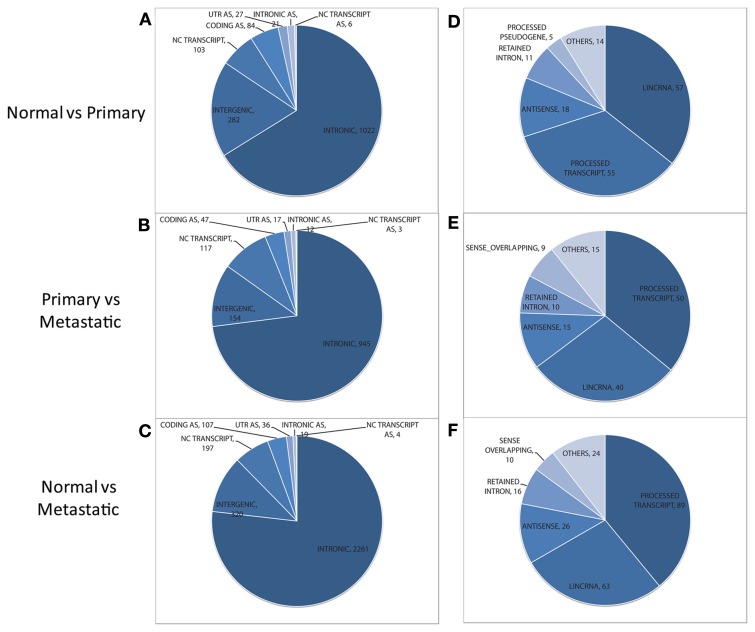
Figure 2.
Distribution of non-exonic features (left) and overlapping annotated non-coding transcripts (right) found to be differentially expressed between normal and primary tumor (A,D), primary tumor and metastatic tissue (B,E), and normal vs. metastatic tissue (C,F). Features in the NC TRANSCRIPT slice of each pie chart (left) are assessed for their overlap with non-coding transcripts to generate the distribution of transcripts (shown at the right for each pairwise comparison). AS, antisense. UTR, untranslated region; lincRNA, long intergenic ncRNA.

