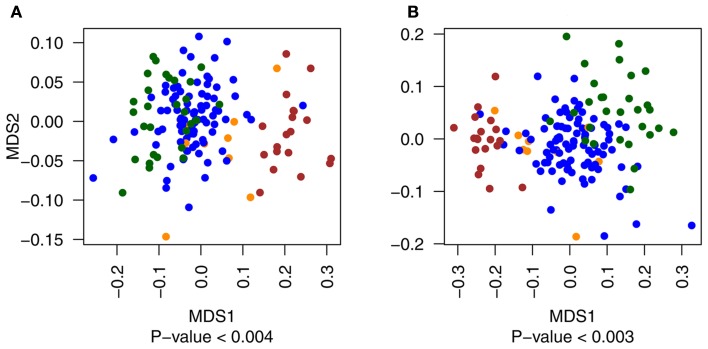
Figure A1.
Multidimensional scaling plots of the distribution of primary tumor samples with (yellow) and without (blue) metastatic events compared to metastatic (red) and normal (green) tissues for exonic (A) and non-exonic (B) features. Metastatic and normal data points are included in the figure for illustrative purposes only.

