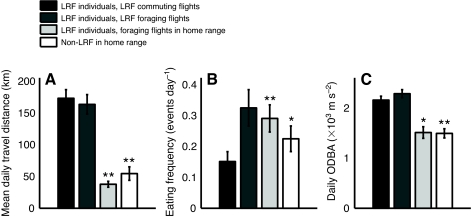
Fig. 6.
Pairwise comparisons among three measures – (A) mean daily travel distance, (B) eating frequency and (C) total daily ODBA – derived from the data (±s.d.) for an individual vulture in the following phases of its lifetime movement pathway: commuting phase of a long-range foray (LRF) event (black); foraging phase far from its home range (dark gray), in the home range shortly after return from the long journey (pale gray) and randomly selected conspecifics within the home range during the time of the LRF (white). Control groups that are significantly different from LRF events are marked as follows: *P≤0.05; **P≤0.01.

