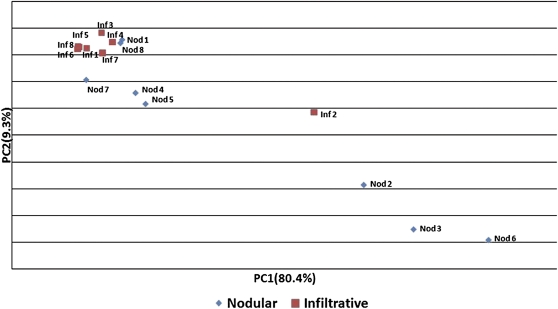
Figure 2 .
Principal components analysis of 16 tumors on the basis of total miRNA expression. Infiltrative tumors clustered tightly with the exception of Inf 2, which was the smallest of the infiltrative tumors and which had a significant nodular component. Nodular tumors had a much broader distribution, reflecting the increased heterogeneity of the subtype. Nod1 and Nod8, which clustered near the infiltrative tumors, were the largest of the nodular class. The axes, principal components one and two, are produced by determining the variability of miRNA expression within the total dataset and collapsing correlating variance into a reduced set of values. The first two components account for 89.7% of the total variance within the dataset; none of the remaining components account for more than 3.0%.

