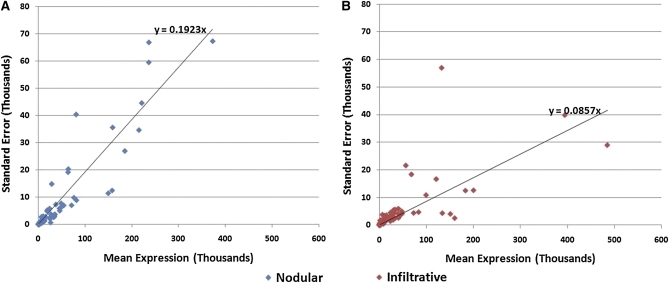
Figure 3 .
Characterization of variance within BCC classes. Standard error vs. mean expression was graphed for each miRNA. Nodular tumors (A) have a standard error relative to the mean of 0.1923, approximately twice that of infiltrative specimens (B) at 0.0857. These data suggest that the wide distribution of nodular tumors in principal component analysis is attributable to an overall pattern of higher variance in expression of miRNAs rather than a few highly variable miRNAs.

