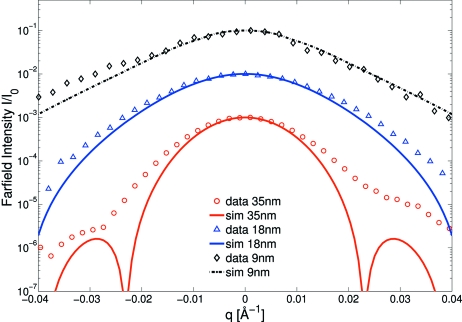
Figure 8.
The normalized far-field intensity distributions of the waveguides as a function of the scattering vector  along with simulations (shifted for clarity). The far-fields are shifted for clarity. The FWHM obtained from Gaussian fits (not shown) are higher in the case of the mono-modal WG compared with the two-modal WG. The tails of the 9 nm WG are more pronounced than for the 18 nm WG far-field.

