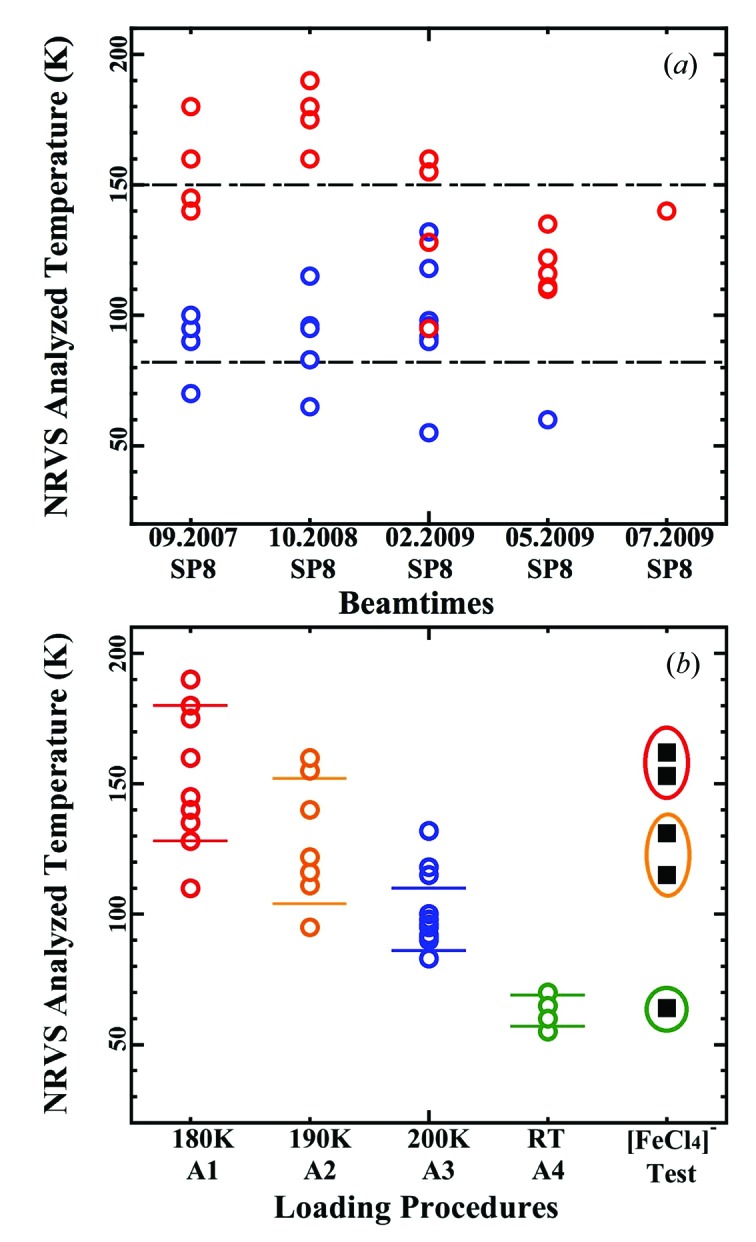
Figure 3.

(a) Real sample temperatures during NRVS measurements for various samples and during various beam times using the LT grease as the cryogenic adhesive: protein samples (red circles) and chemical complexes (blue circles); the dash-dotted lines are the statistical error bar of ±1σ; (b) the same data as (a) re-illustrated against their loading procedures: A1 (180 K, red circles), A2 (190 K, orange circles), A3 (200 K, blue circles) and A4 (RT, green circles); the right-most column in (b) are the results from the standard NRVS tests on [FeCl4]− (filled black squares) with loading procedures A1 (inside the red circle), A2 (inside the orange circle) and A4 (inside the green circle).
