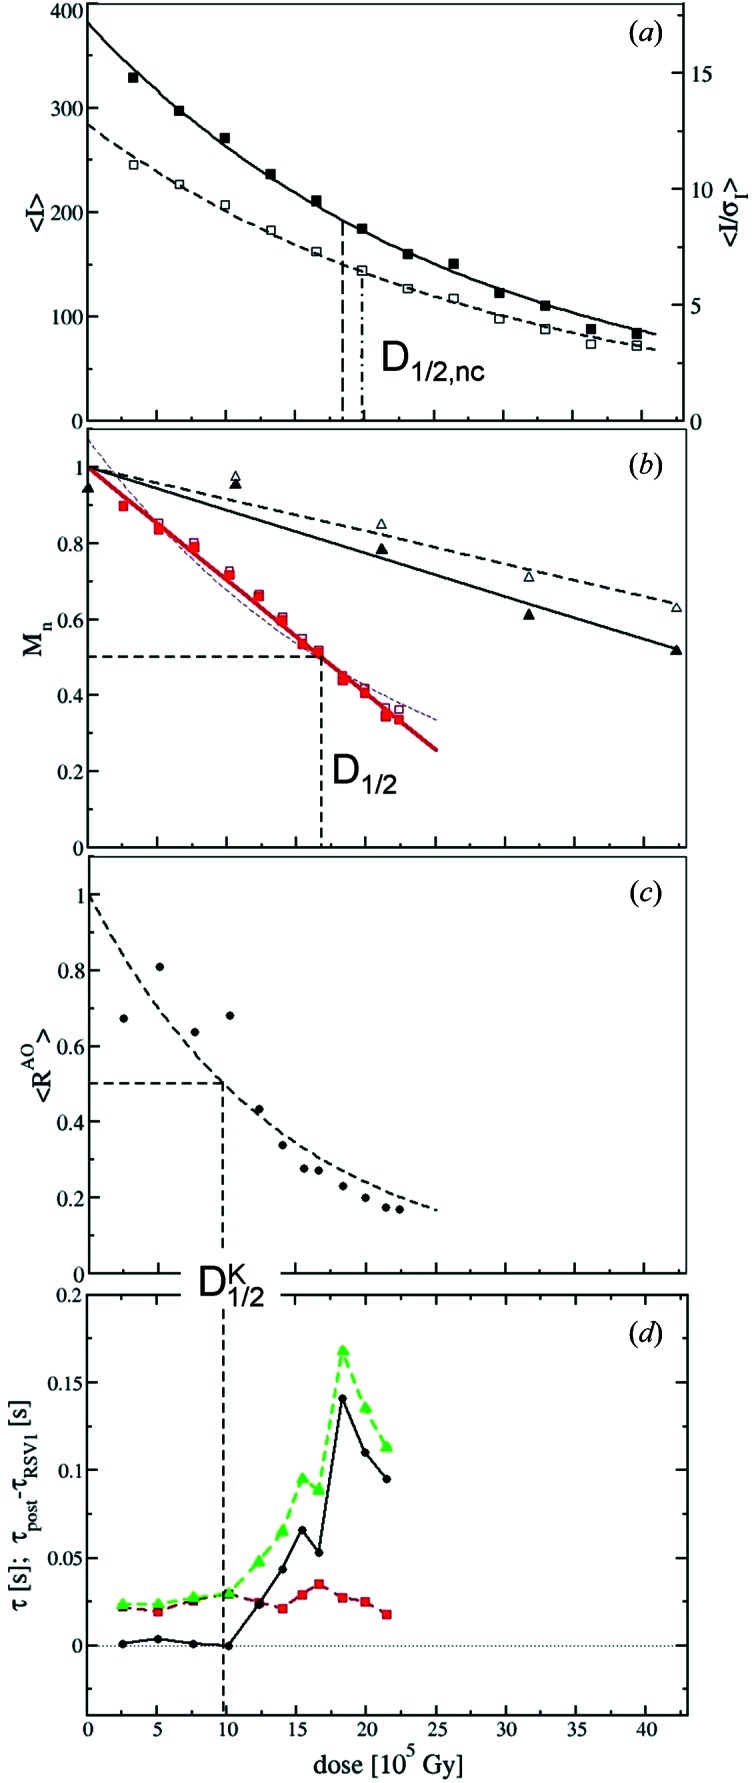
Figure 4.

(a) Raw mean intensities 〈I〉 (solid squares) and 〈I/σI〉 (open squares) as a function of the uncorrected dose. Black and dashed lines: fits by exponential functions. Vertical dashed and dashed-dotted lines indicate the D
1/2 obtained with the uncorrected dose. (b) Normalized quantities M
n plotted as a function of adjusted dose. Average intensity 〈I〉free (red solid squares) and 〈I/σI〉free (red open squares) are plotted as a function of adjusted dose. Red solid line: fit by a straight line. Thin dotted line: fit by an exponential function. The dashed vertical line indicates the corresponding D
1/2. Black solid and black open triangles: variation of the mean intensity 〈I〉L and 〈I/σI〉L, respectively, observed in the control experiment as a function of virtual dose. The black solid and dashed lines are fits by a straight line. (c) Normalized R
AO values (black spheres) as a function of adjusted dose. Black dashed curve: fit by a single exponential. The horizontal/vertical dashed lines indicate  and the corresponding kinetic dose limit
  . (d) Red squares: relaxation times τRSV1 from the SVD analysis as a function of adjusted dose. The red dashed line is a guide to the eye. Green triangles: inverse of the rate coefficient (relaxation time τpost) obtained from posterior analysis. The green dashed line is a guide to the eye. Black spheres: difference between τpost and τRSV1. The dashed vertical line indicates the kinetic dose limit
  .
.
