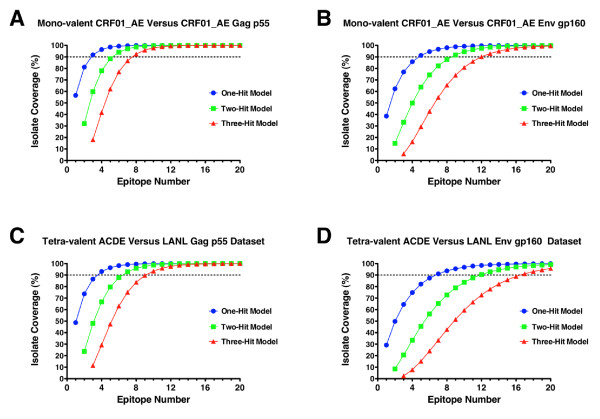
Figure 3.
Comparison of epitope requirements for vaccine coverage in multiple-epitope hit models. Comparisons of 1-, 2- and 3-exact hit epitope requirement models are shown for a mono-valent product (MVA-CMDR Gag and Env inserts) assessed against a dataset of homologous subtype (CRF01_AE) derived sequences (88 Gag sequences, Panel A; 112 Env sequences, Panel B). For contrast a tetra-valent formulation of the products (ACDE) assessed against the entire HIV-1 group M Gag (Panel C) and group M Env (Panel D) datasets is also shown. In all graphs the 1-hit model is represented by the blue line and symbols, the 2-hit model is the green line and symbols and the 3-hit model is the red line and symbols. For reference, the 90% coverage point for each dataset is again denoted by a dotted line on each graph.

