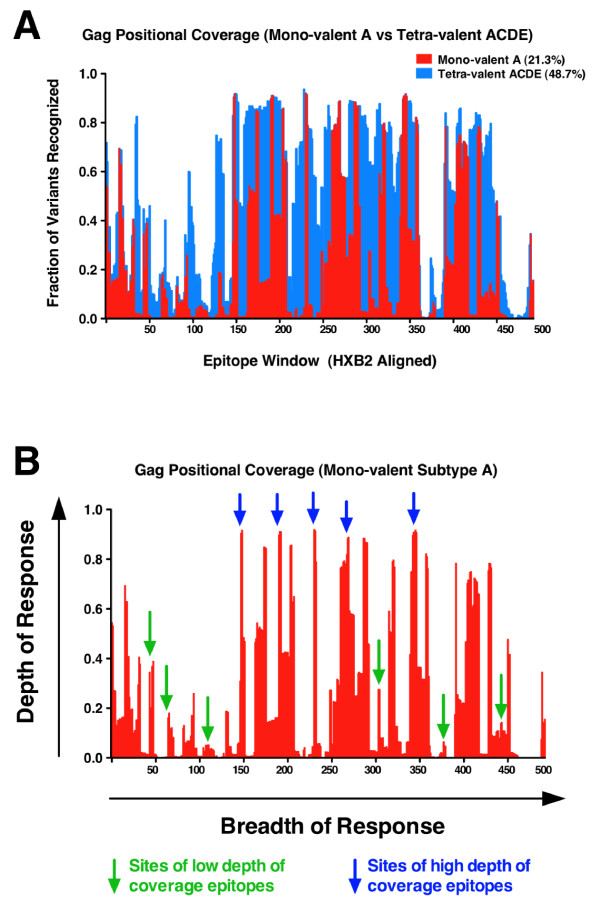
Figure 5.
Illustration of positional coverage for group M Gag sequences by a mono-valent versus a tetra-valent vaccine product. Positional coverage of a group M Gag dataset (2385 sequences) is shown for the mono-valent subtype A vaccine product (MVA-KEA) and a tetra-valent formulation of the four products (ACDE). The fraction of variants with exact 10-mer matching in 493 successive windows of 1 amino acid across the Gag dataset (2385 proteins aligned to HXB2) for the monovalent formulation (red) and tetra-valent formulation (blue) is shown (Panel A). Potential examples of high- and low-depth of coverage epitopes are superimposed upon the positional coverage diagram to illustrate breadth and depth of coverage (Panel B).

