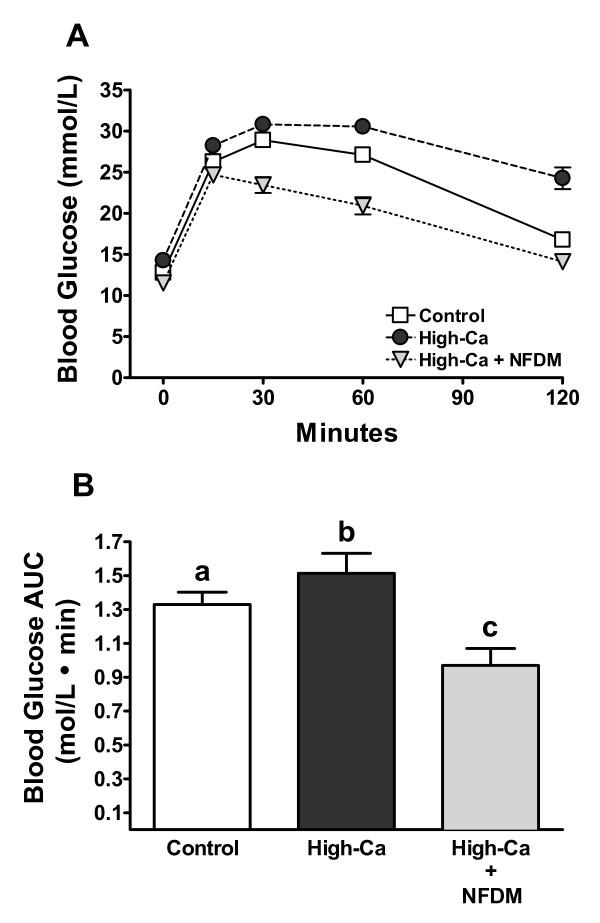
Figure 3.
Blood glucose concentrations (A) and AUC (B) in DIO mice fed 0.5% Ca (Control), 1.5% Ca (High-Ca), or 1.5% Ca + nonfat dry milk (High-Ca + NFDM) following an i.p. glucose tolerance test. Values are means ± SE, n = 15 or 16/treatment. Some error bars are within symbols. Treatments with different letters are significantly different (P < 0.05). Fasting blood glucose was reduced in mice fed high-Ca + NFDM (11.5 ± 0.3 mmol/L) compared to DIO controls (12.8 ± 0.4 mmol/L; not significant) and mice fed high-Ca (14.3 ± 0.8 mmol/L; P < 0.01).

