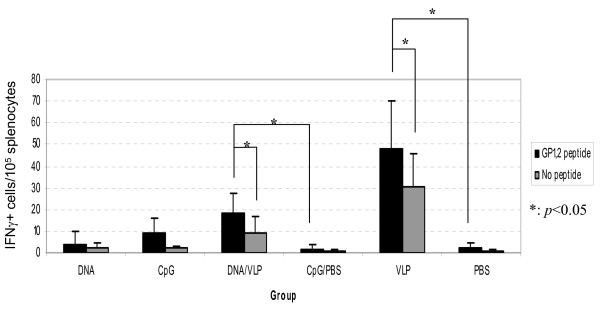
Figure 7.
Cellular Immune Response. Splenocytes of each mouse in the VLP group (n = 5), DNA group (n = 6) and the DNA/VLP (n = 7) were stimulated with three EBOV GP1,2 peptides (ZGP-1, ZGP-4 and ZGP-5) or no peptide as a negative control. Three replicates were used for each combination. Splenocytes from a single mouse were used for each negative control group: CpG, CpG/PBS, and PBS. The numbers of IFN-γ secretion cells (spots) were counted using an ELISPOT reader (Axio Imager M2, Zeiss, Thornwood, NY). Representative data from two experiments are shown.

