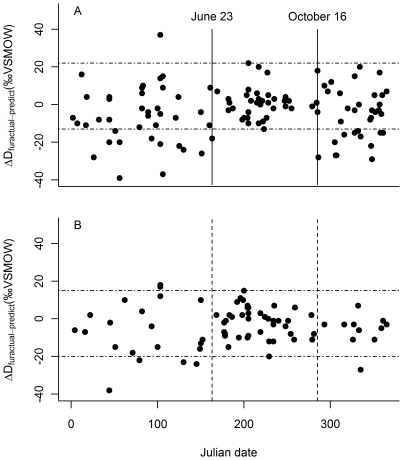
Figure 4. Identification of latitudinal migrants.
The range of variation in molt period ΔDfuractual-predict values (where “molt period” refers to the estimated molt period shown in Figure 2) is indicated with horizontal dashed lines. Individuals with ΔDfuractual-predict values below the horizontal band likely did not grow their fur at their collection site, and are assumed to have migrated from a more northern location. Thirty-three percent of all males (n = 111) (panel A) and 16% of all females (n = 73) (panel B) collected during the non-molt period appeared to be south of their location of fur growth. One non-molt period male and two females appeared to be north of their location of fur growth.

