
Figure 6.
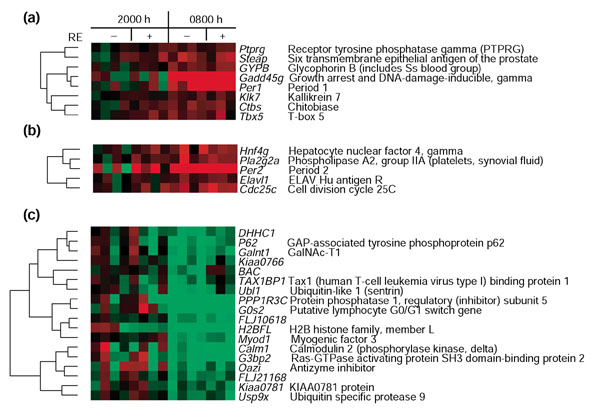
Cluster of genes regulated in the 0800 hours biopsies. Columns indicate each subject and rows indicate individual genes. Each gene is represented by the difference of the gene-expression value and the average expression value of the four non-exercised control legs 6 hours after RE. Red indicates upregulated genes; green indicates downregulated genes. Gene names and descriptions (or GenBank IDs) appear to the right. (a) Per1 0800 hours upregulated cluster. (b) Per2 0800 hours upregulated cluster. (c) 0800 hours downregulated cluster.