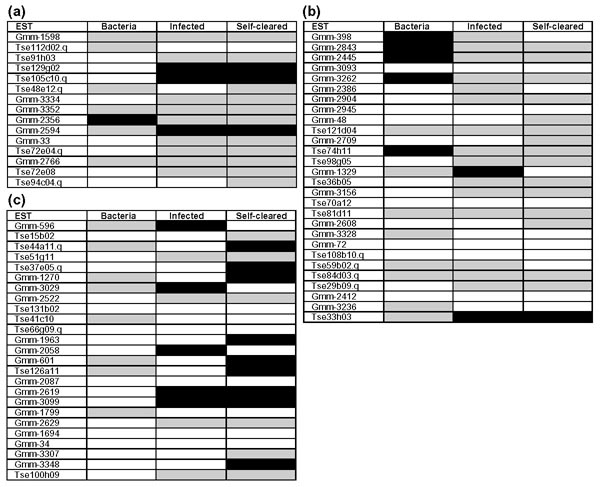
Figure 2.

Expression profiles of putative immunity genes following bacteria or trypanosome challenge. Macroarrays were produced for the 68 putative immunity-related genes listed in Tables 1,2,3. The contig (Gmm-) or clone identifier (Tse) is given for each gene in the same order as Tables 1,2,3; so (a) contains the protease-related ESTs (Table 1), (b) contains the adhesion molecules (Table 2) and (c) contains the miscellaneous ESTs (Table 3). Bacteria column: one-day old, bacteria-fed flies divided by the average of one-day-old fed control flies; Infected column: trypanosome-infected flies divided by the average of an equivalent set of non-challenged control flies; Self cleared column: flies which have cleared a trypanosome infection divided by the average of an equivalent set of non-challenged control flies. For full details see Materials and methods. The following number of arrays (n) were screened: one-day old, fed control flies (n = 5); bacteria-fed flies (n = 4); non-trypanosome-challenged control flies (n = 5); self-cleared flies (n = 4); infected flies (n = 5). A black box indicates at least a doubling of expression levels in at least n-1 of the observations compared to the average of the control. A gray box indicates at least a halving of expression levels in at least n - 1 of the observations compared to the average of the control. A white box indicates no change in expression level.
