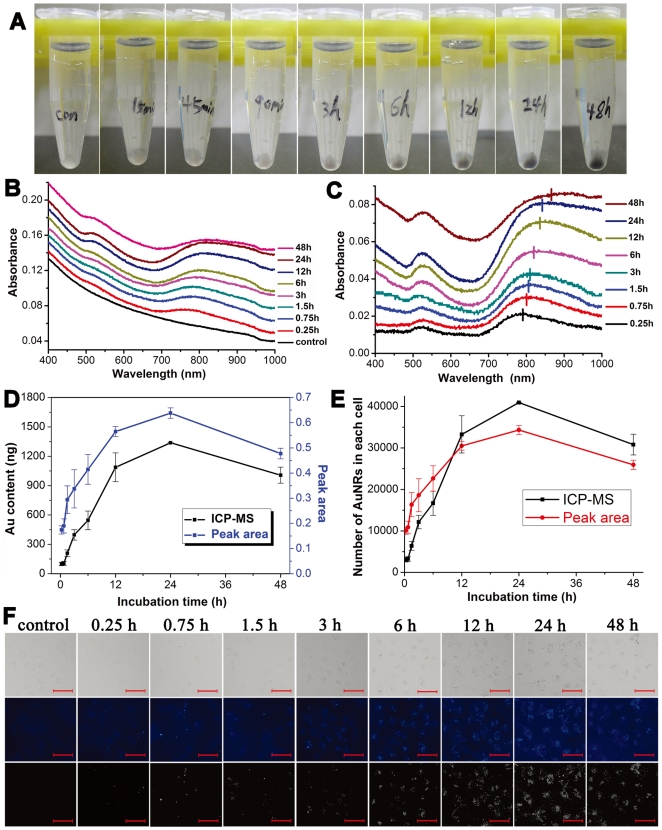
Figure 2. Analysis of AuNRs internalized by MDA-MB-231 cells vs incubation time.
(A) Pellets of the cells incubated with AuNRs for 0.25, 0.75, 1.5, 3, 6, 12, 24, and 48 hours. Cells with no treatment are control. (B) The representative UV-vis-NIR absorption spectra of the cells incubated with AuNRs for different hours. The curves are offset for clarity. (C) The absorption spectra of AuNRs in cells. The absorption from the control cells is subtracted as background and the spectra are offset for clarity. (D) Comparison between results obtained from ICP-MS and TSPR peak area value. (E) The data acquired from the ICP-MS and TSPR peak area is converted to number of AuNRs contained in each cell. (F) Bright and dark field microscopic observation of the cells incubated with AuNRs for different hours (TSP/AuNRs is 250). The first line is the bright field microscopic observation. The second and third line is the dark field microscopic images with and without false color. The scale bar represents 50 µm.

