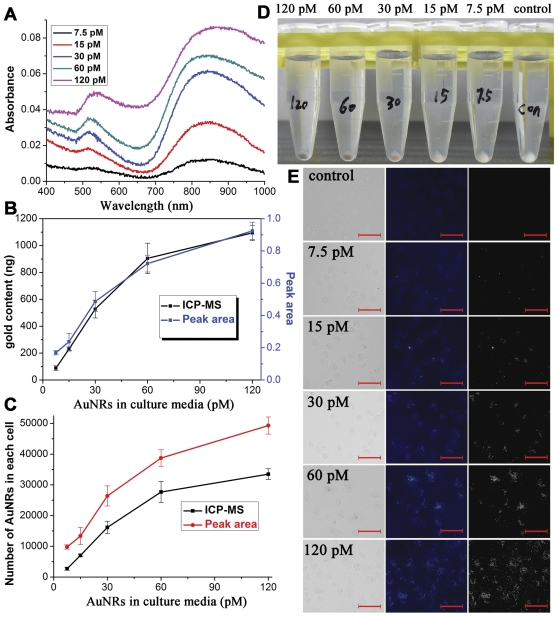
Figure 3. Analysis of AuNRs internalized by MDA-MB-231 cells vs AuNRs concentration.
(A) Typical absorption curves of AuNRs in cells cultured with different AuNRs dosages for 6 hours. The curves are offset for clarity. (B–C) A comparison between the quantification methods of ICP-MS and TSPR peak area calculation. (D) Digital photographs of AuNRs-contained cell pellets co-cultured with different amount of AuNRs in media for 6 hours. (E) Dark field microscopic observations of cells incubated with different concentrations of AuNRs in the media. The red scale bar is 50 µm.

