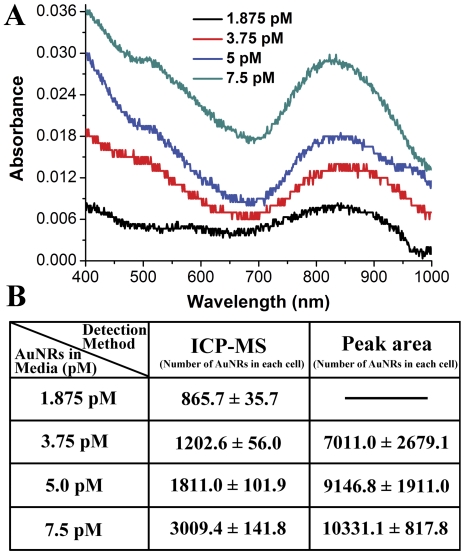
Figure 4. Determination of the minimum detectability of the spectroscopic analysis.
(A) Representative absorption spectra of AuNRs in cells after 6-hours incubation with 1.875, 3.75, 5 and 7.5 pM AuNRs in culture media. The curves are offset for clarity. (B) Comparison between the minimum detectability of ICP-MS and TSPR peak area calculation in quantifying AuNRs in cells. The Au content in cells is converted to AuNRs number in each cell. The numbers are presented as Mean±SD from three parallel experiments.

