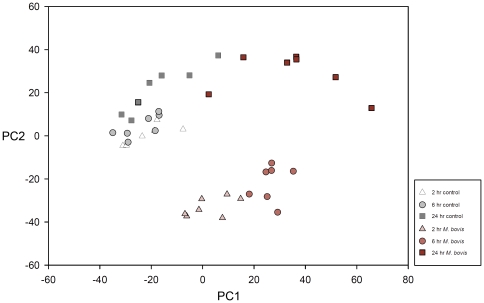
Figure 2. Principal component analysis for all individual control and M. bovis-challenged MDM at the 2 hour, 6 hour and 24 hour time points.
Principal component (PC) 1 and PC2 are shown (accounting for 23.31% and 17.05% of the total variation, respectively). PCA was performed using data for all genes whose probes passed the data filtering process with Euclidean distance as the distance metric.

