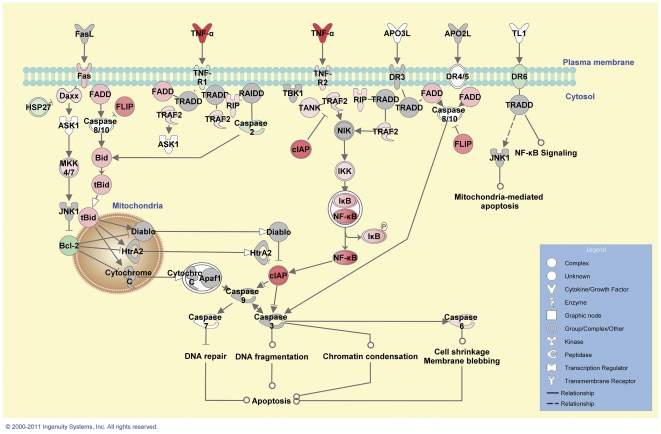
Figure 5. Differential gene expression associated with apoptosis 6 hours post-M. bovis challenge.
Genes associated with apoptosis showing differential expression are highlighted in colour. Colour intensity indicates the degree of upregulation (red) or downregulation relative to the control MDM. Grey shading indicates genes that were not differentially expressed; white shading represents genes in the pathway not represented on the microarray.

