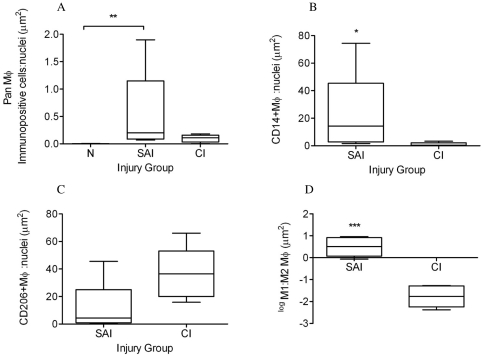
Figure 5. Box plots illustrating ratios of areas (µm2) of immunopositive cells: counterstained nuclei.
(A) CD172a pan Mϕ in normal (uninjured), sub-acute and chronic injured equine tendons; (B) CD14high (M1Mϕ) and (C) CD206high (M2Mϕ) expression in sub-acute and chronic injured tendons respectively. (D) Log transformed ratio of areas of positive immuno-reactivity for M1∶M2 Mϕ from dual labelled CD14 and CD206 sections of sub-acute and chronic injured tendons. SAI = sub-acute injury (n = 5), CI = chronic injury (n = 5), N = normal tendon (n = 5). All values represent median with maximum and minimum range. *** P<0.001, ** P<0.01, * P<0.05.

