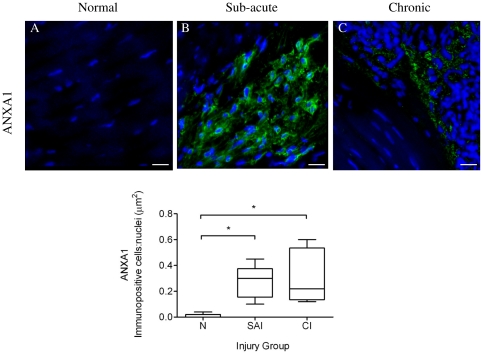
Figure 11. Panel of representative 3-dimensional reconstructed Z stack immunofluorescent images of equine SDFT sections.
Annexin A1 (ANXA1) staining is shown for is for (A) normal, (B) sub-acute and (C) chronic injured tendons. Immunopositive cells are green; blue represents Hoechst nuclear counter stain. Scale bar = 20 µm. Box plot shows significantly increased Annexin A1 expression in sub-acute and chronic injured tendons compared to low level expression in normal tendons. SAI = sub-acute injury (n = 5), CI = chronic injury (n = 5), N = normal tendon (n = 5). Values represent median with maximum and minimum range. * P<0.05.

