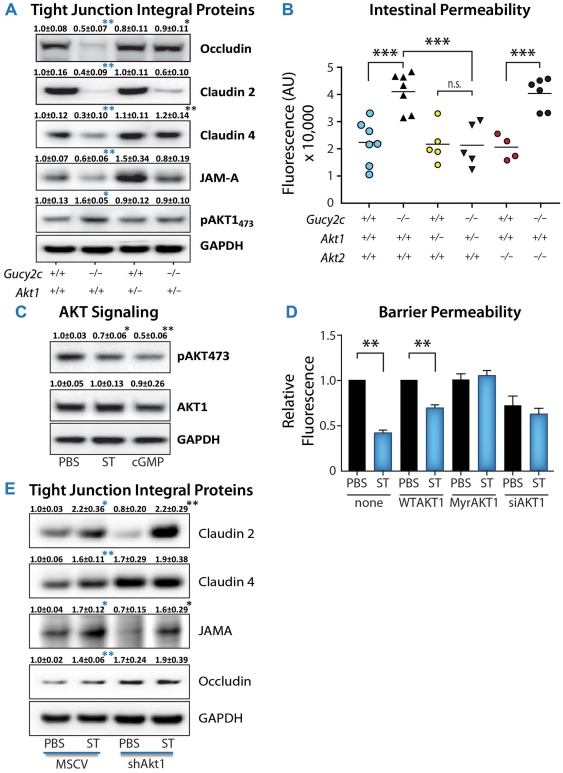
Figure 6. GUCY2C regulation of barrier integrity is AKT1-dependent.
(A) Immunoblot analysis of tight junction proteins from jejuna of 12 week-old mice (n≥7). Data represent means ± SEM. Blue asterisks compare results to Gucy2c+/+, black asterisks compare results to Gucy2c−/. (B) Intestinal permeability was examined by serum fluorescence 90 min after FITC-dextran gavage. Each point represents one mouse. (C) Regulation of AKT phosphorylation by GUCY2C signaling in Caco2 human colon cancer cells was examined by immunoblot analysis. Data represent means ± SEM of 3 experiments done in duplicate. (D) AKT1 signaling in Caco2 cells was manipulated by adenovirus-delivered AKT1 (WTAKT1), constitutive active AKT1 mutant (MyrAKT1), or siRNA against AKT1 (siAKT1). Two days after infection, cells were treated with ST for 6 d. Barrier permeability was examined by FITC-dextran diffusion. Data represent mean ± SEM obtained from one of five experiments done in triplicate. (E) Tight junction protein expression was examined by immunoblot analysis in Caco2 cells stably expressing empty vector (MSCV) or shRNA against AKT1 (shAKT1) after 6 d of ST treatment. Data represent means ± SEM of three experiments done in duplicate. Blue asterisks compare results to MSCV-PBS, black asterisks compare results to MSCV-ST. *, p<0.05, **, p<0.01, ***, p<0.001. In C–E, statistical analyses were compared to PBS control.

