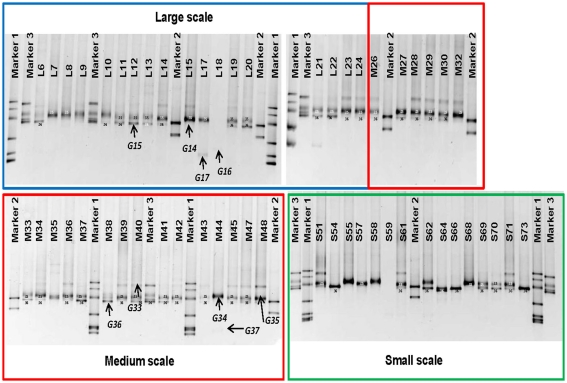
Figure 2.
DGGE patterns showing the distribution of iron-oxidizing bacteria at different sampling scales, which are indicated by colored boxes. Bands G14–G17 and G33–G37 were sequenced and shown in Figure 4. Sequenced clones obtained previously were used as markers. Marker1: MWE_C40(FJ391490), MWE_N41(FJ391496), MWE_N34(FJ391502), MWE_N13(FJ391501), MWE_N19(FJ391497), and MWE_N26(FJ391498), Marker2: Hc1(FJ391520), and Hc25(FJ391510), Marker3: Hc9(FJ391509), Hc37(FJ391515), Hc16 (FJ391516), and Hc8(FJ391513; Wang et al., 2009).

