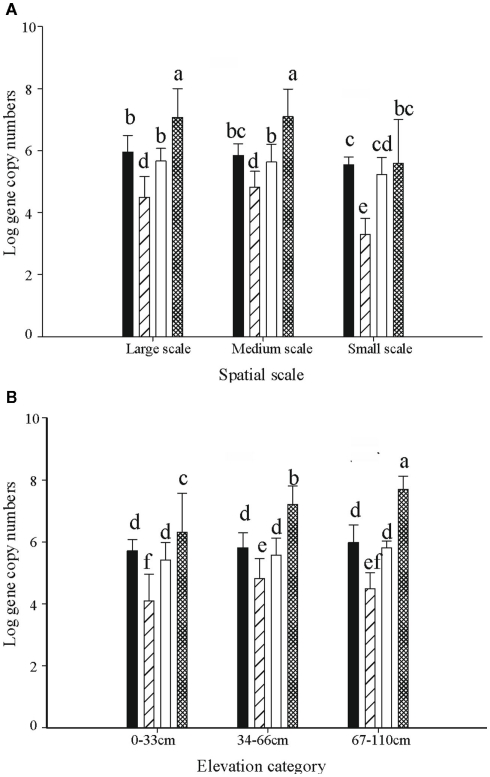
Figure 5.
The distribution of 16s rRNA copy numbers of Ga-FeOB and pmoA gene copy numbers of MOB (both expressed per gram of dry soil) at different spatial scales (A) and elevation levels (B). Indicated are means ± SD. Black bars depict type II, striped bars type Ia, and white bars type Ib MOB, while hatched bars show the Ga-FeOB. Different letters indicate significant differences (p < 0.01) between bars. For numbers of observations see footnote of Table 1.

