
Figure 1.
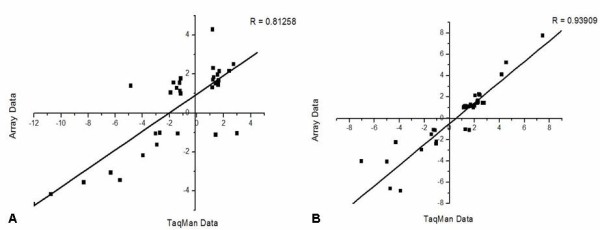
Validation of mEC and mES microarray data. Microarray data was validated through qPCR (TaqMan) analysis of a group of 36 genes. Data presented represents gene expression change in differentiated cells compared to undifferentiated and shows good correlation for mES (A) and PSA-SCC1 (B) datasets.