
Figure 3.
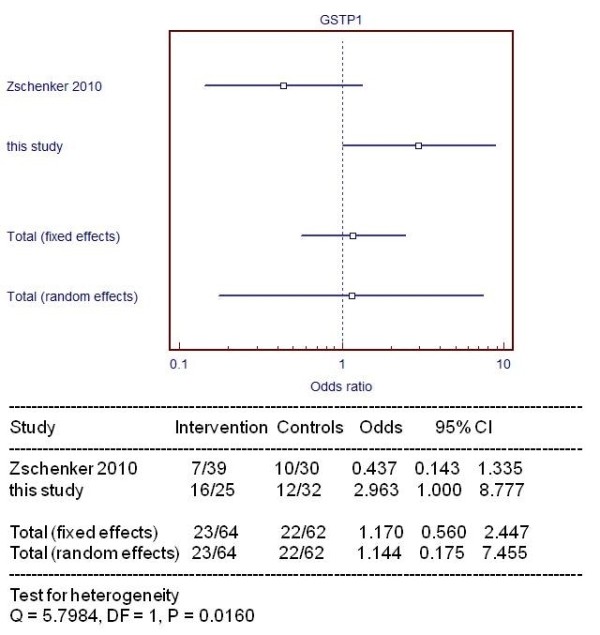
Forest plot summarizes a pooled analysis of G2 or more fibrosis/fat necrosis distinguishing patients with/without het/mut GSTP1. The mutation is toxic or protective when OR is higher or lower than 1, respectively.
Official websites use .gov
A
.gov website belongs to an official
government organization in the United States.
Secure .gov websites use HTTPS
A lock (
) or https:// means you've safely
connected to the .gov website. Share sensitive
information only on official, secure websites.
Forest plot summarizes a pooled analysis of G2 or more fibrosis/fat necrosis distinguishing patients with/without het/mut GSTP1. The mutation is toxic or protective when OR is higher or lower than 1, respectively.