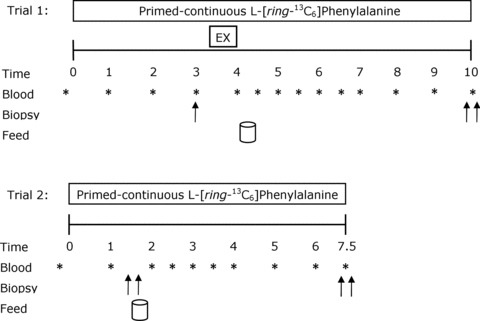
Figure 1. Schematic diagram of the experimental infusion protocols.

Double arrows indicate bilateral biopsies were obtained at corresponding time points. Subjects consumed 20 g of whey protein isolate at the feeding time points.

Double arrows indicate bilateral biopsies were obtained at corresponding time points. Subjects consumed 20 g of whey protein isolate at the feeding time points.