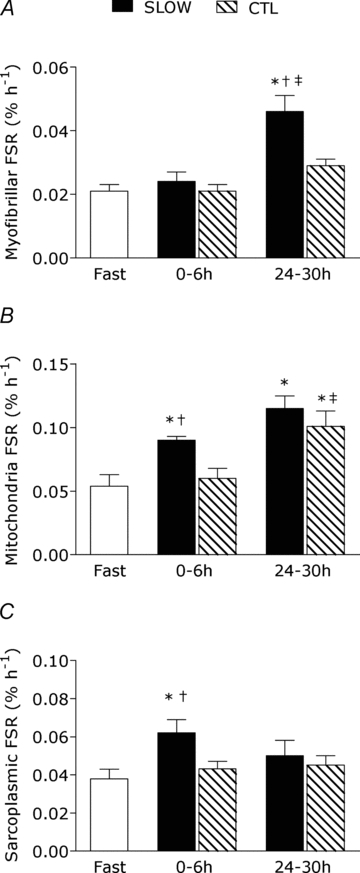
Figure 3. Myofibrillar (A), mitochondrial (B), and sarcoplasmic (C) protein fractional synthetic rates (FSR) during protocols.

Note different scales on y-axes between graphs. Rates are from rested fasted and after resistance exercise with slow (SLOW) or external work match control (CTL) muscle time under tension. Values are means ± S.E.M. *Significantly different from fasting, P < 0.05. †Significantly different from CTL at that same time point, P < 0.05. ‡Significantly different from the 0–6 h response in the same condition, P < 0.05.
