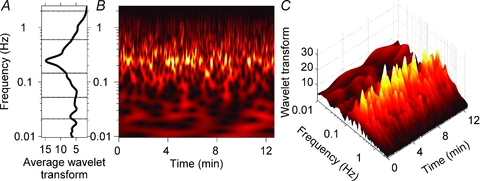
Figure 2. Wavelet transform of skin sympathetic nerve activity from Subject 3.

A, the average wavelet transform of skin sympathetic nerve activity for the recording period. B and C, a contour plot (B) and a three-dimensional plot (C) of the wavelet transform. The strongest periodicity, shown in yellow, is at the respiratory frequency (0.25 Hz). B and C illustrate the complexity of this subject's skin sympathetic rhythms, whose occurrence, frequency and strength were highly variable. The average data shown in A mask the major ongoing fluctuations present in the time series.
