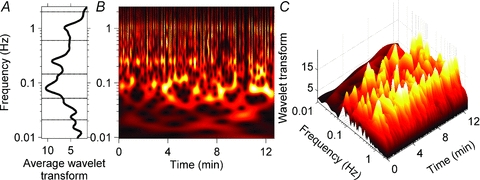
Figure 3. Wavelet transform of muscle sympathetic nerve activity from Subject 2.

A, the average wavelet transform of the muscle sympathetic nerve activity. B and C, contour and three-dimensional plots of the same data. As with the analysis of skin sympathetic nerve activity (Fig. 2), the occurrence, frequency and strength of oscillations varied in major ways during the recording. This is particularly evident in the ∼0.1 Hz rhythm, which appeared and disappeared at highly variable rates. The average data shown in A do not accurately represent these ongoing fluctuations.
