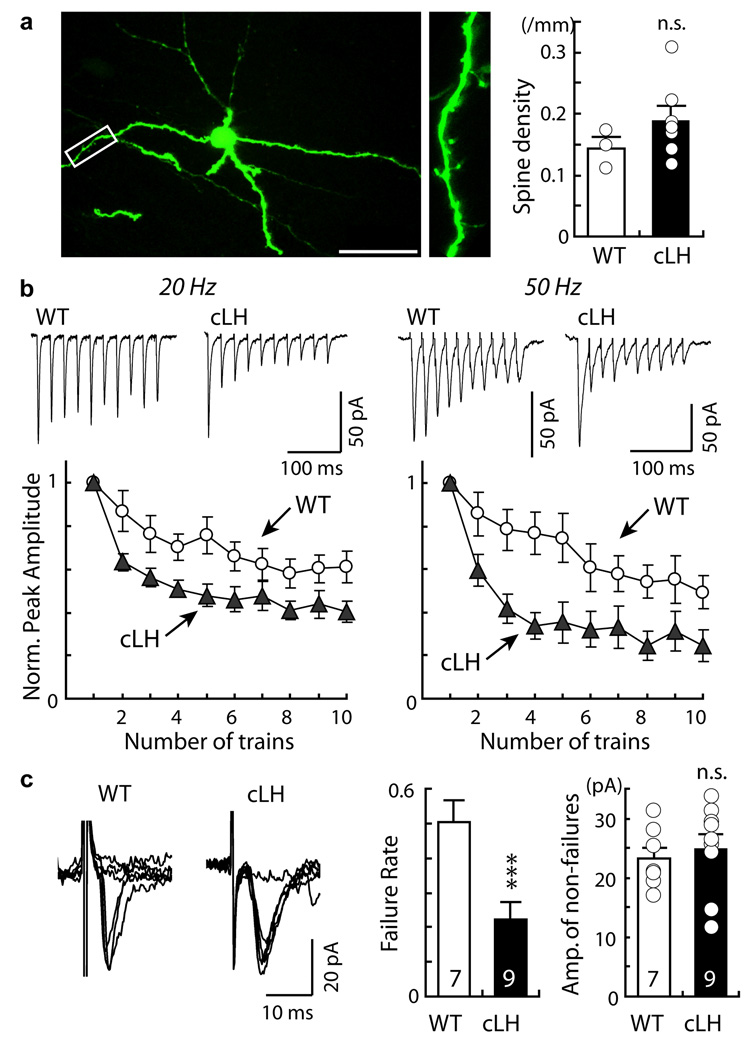
Figure 3. Presynaptic mechanism underlying the increase in excitatory synaptic transmission onto VTA-projecting LHb neurons in helpless animals.
a. Two-photon laser scanning images of a VTA-projecting LHb neuron labeled by in vivo injection into the VTA of a retrogradely transported HSV-GFP virus in low (left) and high (middle) magnifications. Scale bar: 50 µm. Right, dendritic spine density on VTA-projecting LHb neurons of WT or cLH animals (WT: 0.15±0.02, 3 cells, 1125.3 µm total dendritic length; cLH: 0.18±0.02, 7 cells, 1002.4 µm total dendritic length; p>0.1, t-test). b. Top, evoked EPSCs onto VTA-projecting LHb neurons of WT or cLH animals in response to stimulus trains (20 Hz or 50 Hz). Bottom, plot of peak EPSCs normalized to first EPSC (WT: 20 Hz n=10, 50 Hz n=11; cLH: 20 Hz n=14, 50 Hz n=13). Compare to WT, cLH animals showed a faster (20 Hz: F(9, 198)=2.32, p=0.02; 50 Hz: F(9, 198)=3.83, p<0.001) and more extensive (20 Hz: F(1, 22)=6.62, p=0.02; 50 Hz: F(1, 22)=7.15, p=0.01; One-Way ANOVA with repeated measures). c. Left, minimally evoked EPSCs onto VTA-projecting LHb neurons (left) display more failures (middle) in WT than cLH animals (WT: 0.5±0.1, n=7; cLH: 0.2±0.1, n=9, ***p<0.001, t-test). Right, mean amplitude of successful trials (WT: 23.2 ±2 pA, n=7; cLH: 24.8±2.5 pA, n=9; p>0.6, t-test). All error bars represent s.e.m.

